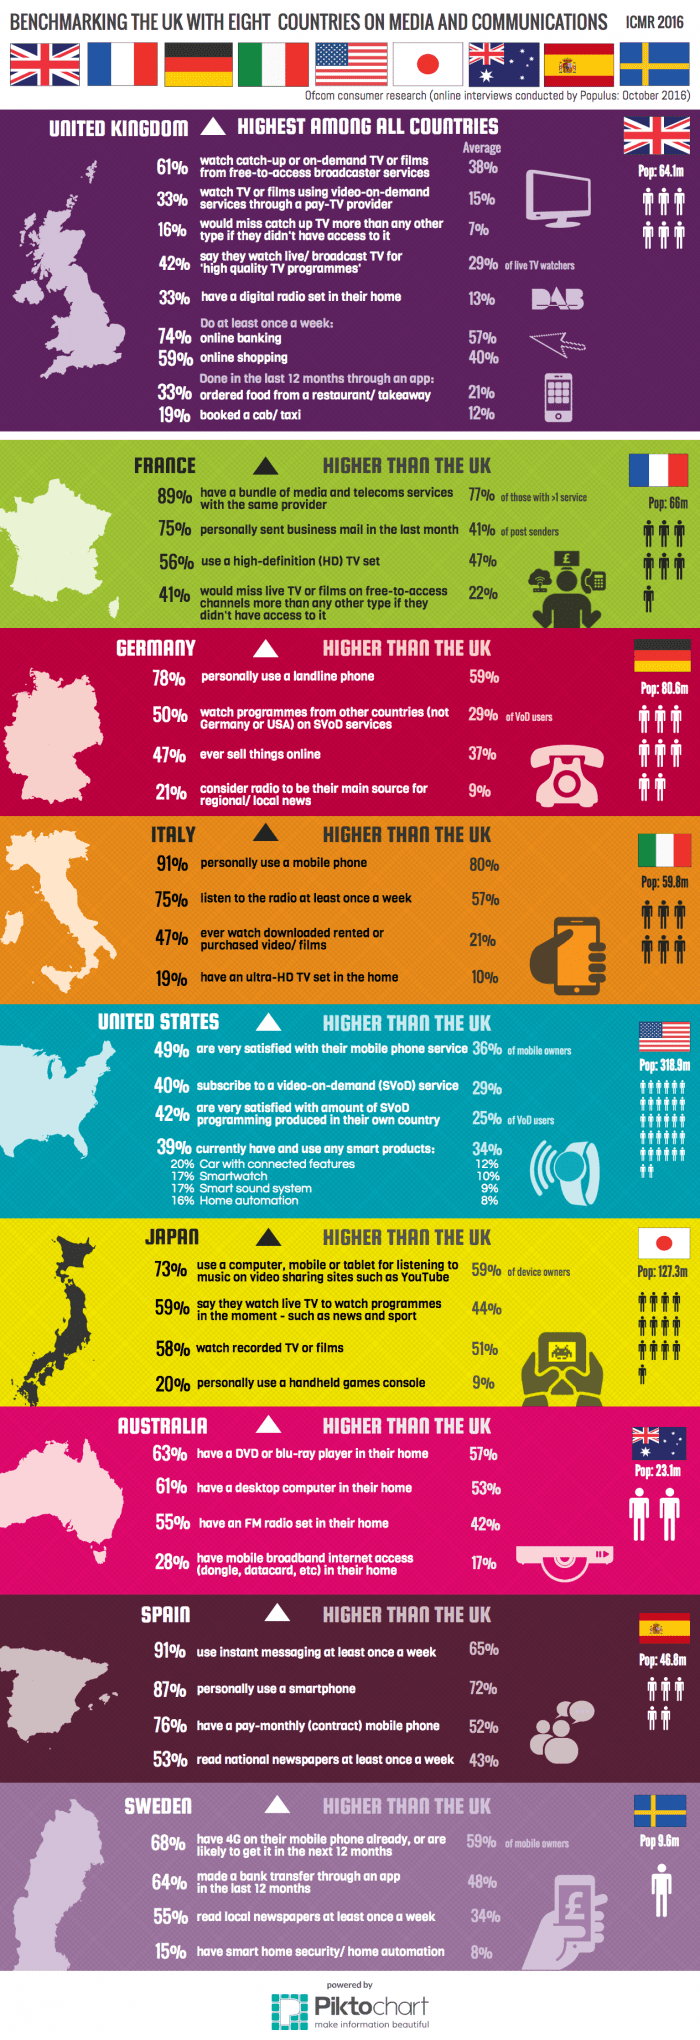
Chart of the Day: Benchmarking digital media and technology adoption of the UK with eight developed countries
At one level, it’s simple. The online opportunity for businesses to reach and influence their audiences online depends on the levels of use of the web by different types of individuals and businesses. Defining the Opportunity, Creating a Digital Strategy and taking action works best if you can define how many of your target audience are actively using digital media and technology to inform their buying decisions.
At another level, it’s now highly complex to define this opportunity. While we can still use search engine gap analysis to assess the number of people searching for information about products online and review our ‘share of search’ or search impressions, many other platforms are involved. These include cross-device use from mobile to desktop and use of social media and influencers. Plus, we shouldn’t forget that, even in developed countries, traditional media remains important.
This infographic from the recently published Communications Market Report International shows the relative importance of digital and traditional media in informing buying decisions based on activity.
An example of the insight available in these reports is that in the UK we can see that 74% use online banking once a week and 59% shop online once a week, that’s significantly higher than 57% and 40% across all 17 countries reviewed in this chart. This variation in adoption between countries, shows both the future potential and need to forecast when international marketing is important to a business.
- Source: Communications Market Report International published December 16th 2016
- Sample:1,000 respondents in each of the nine countries featured in the average: the UK, France, Germany, Italy, the US, Japan, Australia, Spain and Sweden. Plus the report compares to other nations: 1. France (FRA) 2. Germany (GER) 3. Italy (ITA) 4. The United States of America (USA) 5. Japan (JAP) 6. Australia (AUS) 7. Spain (ESP) 8. Sweden (SWE) 9. The Netherlands (NED) 10. Poland (POL) 11. Singapore (SGP) 12. South Korea (KOR) 13. Brazil (BRA) 14. Russia (RUS) 15. India (IND) 16. China (CHN) 17. Nigeria (NGA)
- Recommended toolkit: Running International marketing campaigns
- Other recommended statistics sources: Top digital marketing statistics sources for 2017
from Blog – Smart Insights http://www.smartinsights.com/online-brand-strategy/international-marketing/digital-media-adoption-country-compare/
via Tumblr http://euro3plast-fr.tumblr.com/post/155757942559

No comments:
Post a Comment