Use our new RACE analytics Google Sheet to see your key marketing metrics at a glance
For Marketing, Digital marketing or ecommerce managers, the first week of the month is always a frantic one launching new campaigns, monthly dashboard reviews and on top of that you need to report the performance of your marketing to the internal stakeholders (the boss). Hopefully, it’s a good news story, but if it isn’t, that just adds to the workload, identifying what went wrong and putting plans in place to turn things around.
This is where you need to practice the art of analytics, to quickly create a report or dashboard with a subset of key metrics covering all marketing activities in an easy to understand format for rapid review and recommendations for upcoming activities?
But how do you create a dashboard for reviewing digital marketing performance to compare different time periods such as monthly, weekly, quarterly or annually. While Google Analytics has many, many metrics and many many reports, consolidating them into the measures you need for a dashboard showing a marketing funnel can be a challenge. Sure, you can browse the Google analytics custom dashboard gallery, but you will find that many of these don’t cover the ‘full-funnel’ needed for a strategy or business level review, instead they tend to focus on tools to help with tactics like SEO or social media. You can also use the
This is where the Google Analytics API and the Google Sheets add-on comes into play
The purpose of the Smart Insights dashboard is to help managers to complete a regular weekly or monthly review of the current effectiveness of their digital marketing using Google Analytics with Google Docs Spreadsheets. We use this combination ourselves in our monthly reporting! The dashboard makes it easy to compare digital marketing performance through time with a focus on the key digital marketing measures across the customer lifecycle or marketing funnel defined across the Smart Insights RACE planning framework. For example, you can compare year-on-year or compared to the previous reporting period.
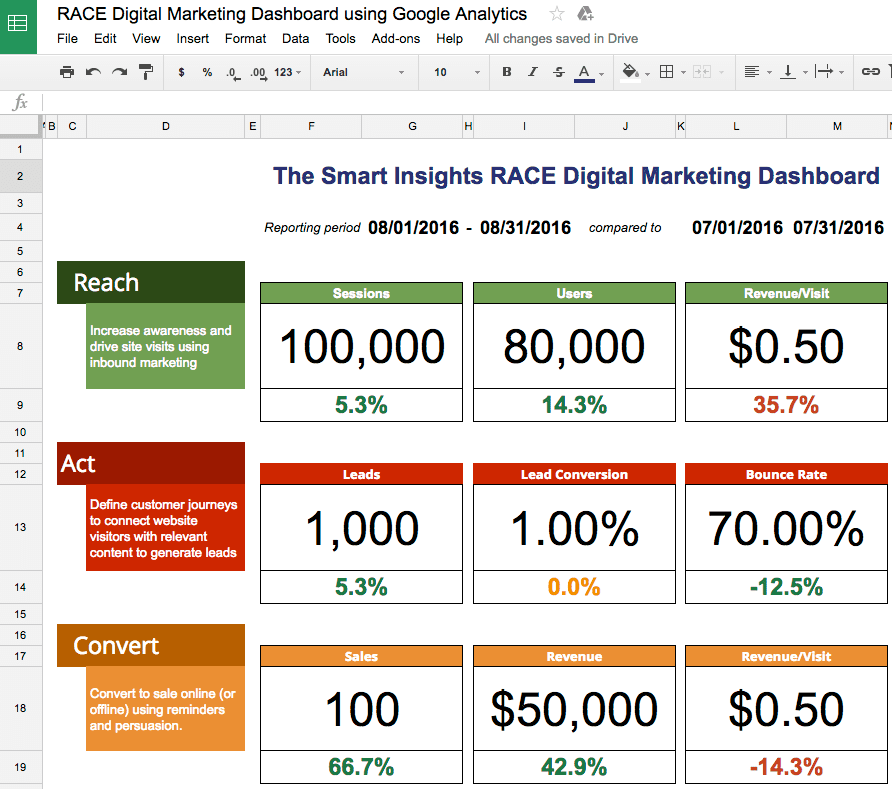
The Smart Insights RACE framework used in all our member resources was developed to help digital marketers plan and manage their activities in a more structured way since we found that many don’t have a digital marketing strategy with clear objectives and KPIs (key performance indicators).
By reporting on just four metrics for each of the Reach, Act, Convert & Engage parts of the funnel you can measure the key areas of your digital marketing plan to see which are working or require attention. In addition to overall visits, leads and conversion, the dashboard also includes key low-cost channels used by many businesses of organic search, social media and email marketing.
How to use the RACE dashboard
What you will need:
- A Google account to open and make a copy of the spreadsheet
- The Google Analytics spreadsheet add-on within Google Spreadsheets click here
- A Google Analytics account
- Your Google Analytics ID
How to get the dashboard
Expert members can get the dashboard by visiting this page.
Please then follow the instructions on the Google Sheets Read page, starting by making a copy. Here are some visual examples to help you.
1. NB. Ensure you use the same Google Account for Google Analytics and Google Sheets.
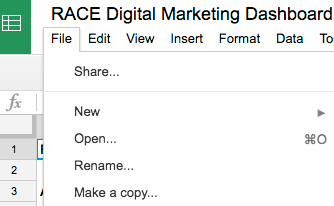
2. Make a copy of this Report - you do this from the “File” menu of Google Sheets > “Make a copy” option
When you first open you will see a blue box, top left, saying the spreadsheet is 'Read-only’
The first thing you should do is to 'Make a copy’ via the file menu, which you use for your internal use.
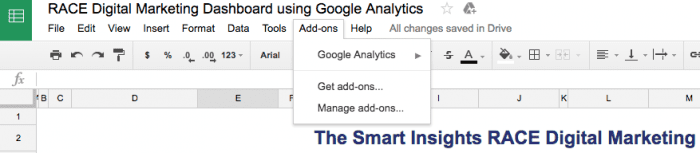
3. Install the Google Analytics Add-on for Google Sheets - Add-ons > Get add-ons in the Sheets menu.
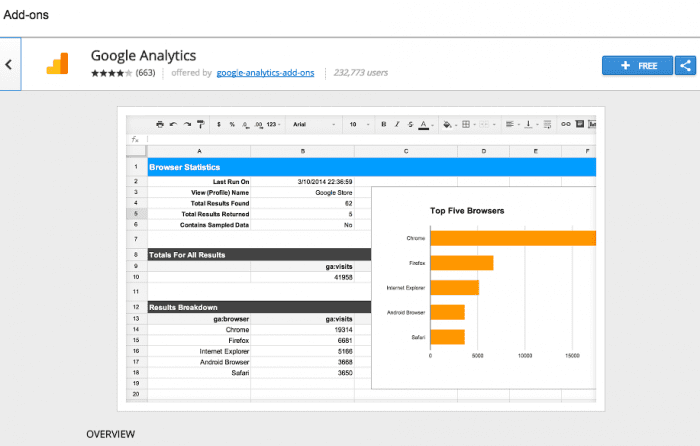
This is how it will look once it is set up. When you first look, Google Analytics won’t be there so you will have to add it using the 'Get add-ons’ option.
Choose 'Get add-ons’ and then search for Google Analytics - you want this one which offers to 'Access all of your Google Analytics data in Google Spreadsheets’ - it’s available from Google.
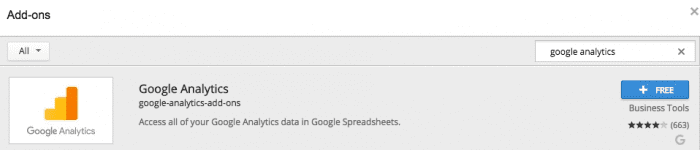
When you click on it you will see these details.
Next click the + Free button and it will be available.
Next, the hardest part which is to find your Google Analytics 'View ID’
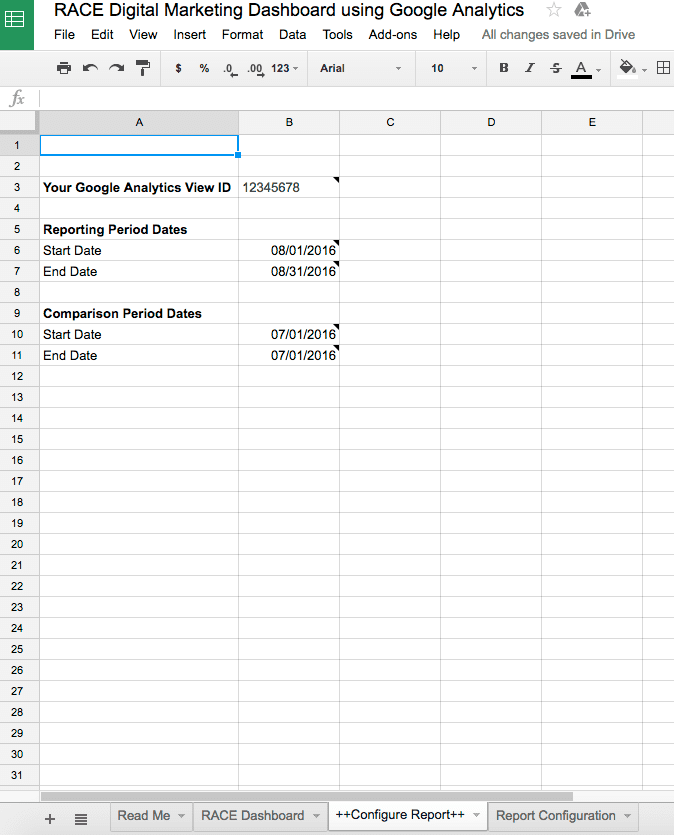
4. Place your Google Analytics View ID on Cell B3, Tab “++Configure Report++”
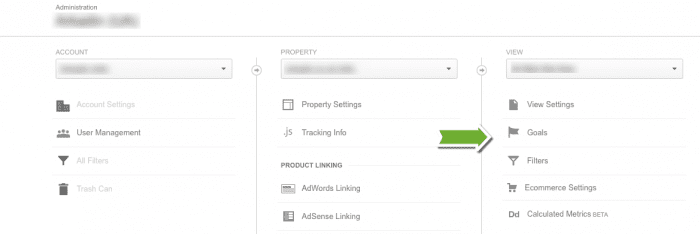
5. Find your GA View ID in analytics to customise it to your business
- Sign-in to your Analytics account.
- Select the Admin tab.
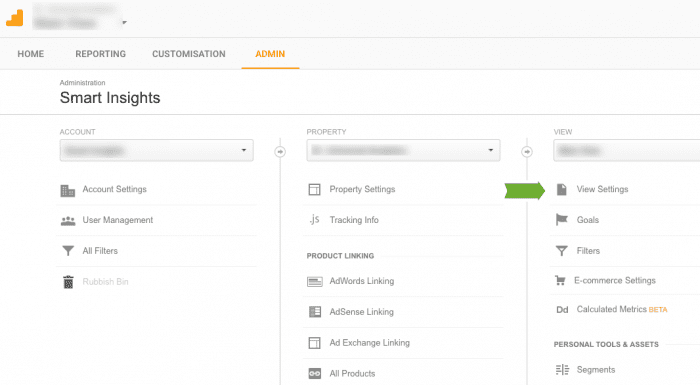
- Select an account from the dropdown in the ACCOUNT column.
- Select a property from the dropdown in the PROPERTY column.
- Under View , click View Settings"
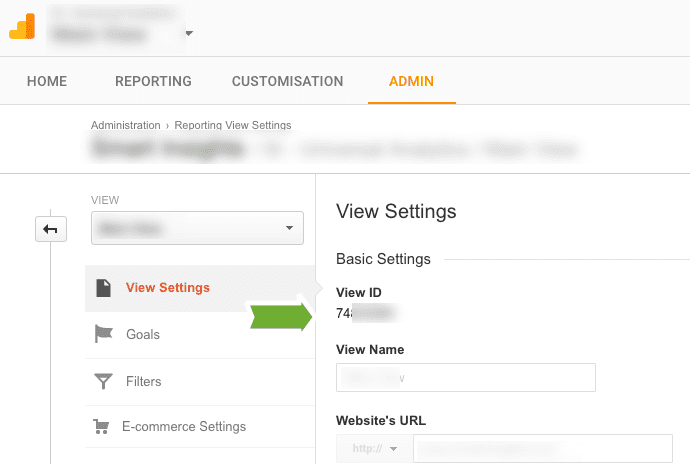 6. Place your Google Analytics View ID on Cell B3, Tab “++Configure Report++”
7. To calculate and display 'Leads’ & 'Sales’, identify which GA Goals are most relevant to you in your view and replace the goal numbers “ga:goal1Completions’ (for Act conversion goal) and ”ga:goal2Completions’ (for Convert goal) in Tab “Report Configuration” Cell B8, C8, D8 & E8
You can find out the Goal numbers by clicking on the Admin tab we mentioned at step 5 and by then clicking on the Goals option under view.
8. Add your reporting dates to Cells B6, B7, B10 & B11.
For example to compare two consecutive months or year on year changes.
You can see an example of this in Step 6 above where we are comparing two months.
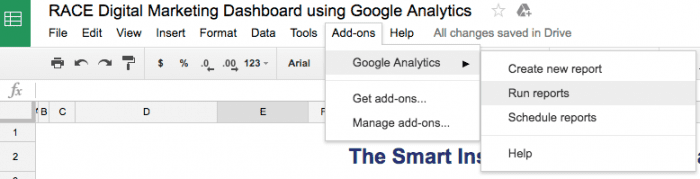
9. Now you are ready to run your first report in the Sheets menu! Simply select “Add-ons” on the Google Sheet > “Google Analytics” > “Run Reports”
Congratulations - The example data on 'RACE dashboard’ sheet should now be updated. If not, carefully check each of the steps above.
Once set up the whole process is more straightforward if you are simply using one Google View / Account. You will just need to repeat steps 8 and 9.
But is my information secure?
Yes!- This dashboard is built using the popular online Google Docs Spreadsheet Sheets to report on business marketing performance using Google Analytics data from your Google Account via the Google Analytics API. This data is only available to those in your business who can sign in with their username and password to have access to the account and know the ID of the website property and view. It is not available to Smart Insights or anyone who doesn’t have this information since the same Google Analytics and Google Docs account must be used.

Download Expert Member resource – RACE Digital Marketing Dashboard
Use our practical reporting dashboard built in a Google Docs Spreadsheet using your Google Analytics data to report on the performance of your digital marketing.
Access the RACE Digital Marketing Dashboard
from Blog – Smart Insights http://www.smartinsights.com/goal-setting-evaluation/web-analytics-strategy/introducing-race-analytics-dashboard-help-stay-top-critical-marketing-kpis/
via Tumblr http://euro3plast-fr.tumblr.com/post/150961716169
No comments:
Post a Comment